Introduction
TL;DR: This mini-tutorial covers some simple methods of optimizing 3D assets, especially for WebXR on mobile VR and AR devices, using free tools like Blender. If you already have a decent handle on WHY your performance is bad and just want the tips, feel free to skip down to the Reducing Draw Calls section below.
The Problem
If you are anything like me, your desire to create cool VR/AR content far outstrips your artistic abilities. If your project doesn’t have a large team or budget backing it up that can create 3D assets on demand it’s natural to turn to the endless flood of creative talent that is the internet to find resources that can support your vision.
One of my favorite sources for 3D content is https://sketchfab.com. Besides being an excellent host for artist portfolios or social media embeds of 3D models, they also have a ton of content available both to purchase and to download for free under the Creative Commons license. PLUS, they have a tool that makes every downloadable asset on the site available as a glTF 2.0 mesh. glTF is an extremely web-friendly format that imports painlessly into most of the popular rendering libraries and frameworks, so you can start seeing content on the screen in your page almost immediately! It’s great!
(This, by the way, is EXACTLY how I made xrdinosaurs.com)
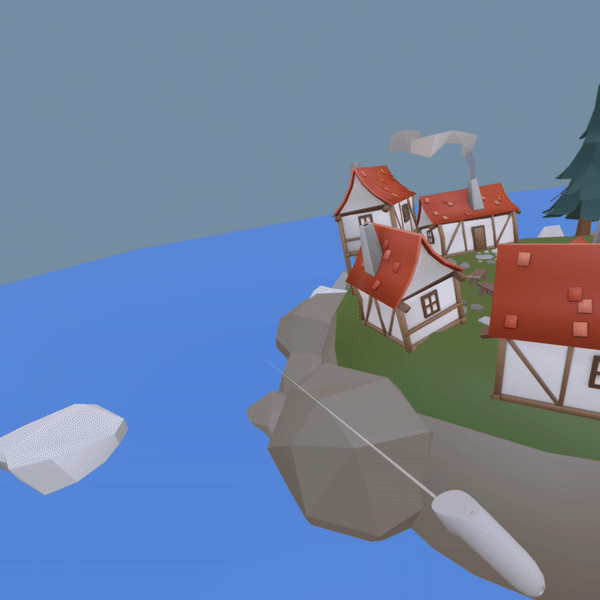
So, you find a model that you think would work great for what you have in mind. For me, I’ll use this adorable little fantasy island scene by Olee. Then you grab your favorite library and throw together a quick test page that loads up the model. I’m going to use Babylon.js because they have an extremely easy utility for adding VR support to your page with built-in teleporting functionality and I want to be able to jump around the island a bit.
My first pass at the code is here. It’s under 100 lines! Not a bad place to start!
You can visit the live version of the unoptimized page here.
So you fire that up on a desktop and it probably works well! Maybe you have a PC VR headset and give that a try and it’s working well too! Hooray!
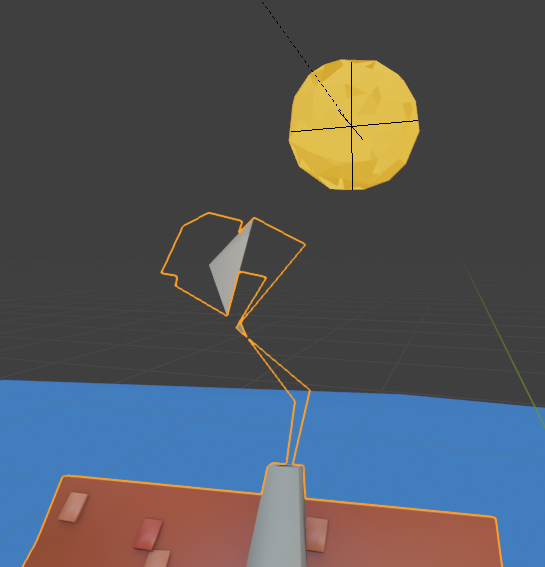
Then you try it on your target device. (I’m gonna use an Oculus Go just to really hammer the point home. It’s a good device with nice WebXR support built in but a relatively weak processor.) And you notice that it’s taking a long time to load, even on your local network. And when it finally does load, you click the VR button and…

(In case you were wondering, all that blackness at the edges is a sign that your content is running very poorly and your users is not having a good time.)
What gives? It’s obviously a low poly scene with no fancy shaders or anything. You definitely feel like you’ve seen more detailed scenes on the same device before. Plus it’s the only thing being rendered and it’s completely static! You’ve barely started and your project is already failing!
Obviously the only logical conclusion is that WebXR sucks, Javascript sucks, Browsers suck, this whole Web thing was probably a mistake to begin with, and the only really viable way to make XR content is Unity. Right?
The Reality
If we take a breath and a step back, though, we’ll see that there’s a lot that we can do to improve performance, and none of it requires us to pull out John Carmack levels of GPU sorcery.
Here’s the truth: Using WebGL for your rendering IS slower than doing the same thing with native code. But it’s only slower in very specific ways, and if you know what they are you can work on avoiding them.
When dealing with performance problems in 3D rendering, we can broadly place our bottlenecks into two categories: Fill Rate limited and Draw Call limited.
Fill Rate problems happen when your GPU simply can’t keep up with the pixels you are asking it to draw. This typically happens because you’ve got a shader that’s really complex or are drawing tons of polygons, especially if you’ve got things like lots of overlapping partially transparent geometry. When you’re Fill Rate limited you generally want to try some combination of making your shaders less expensive, reducing how much you’re drawing and how many lights you’re using, and shrinking the resolution that you’re rendering at. Basically anything that cuts down on how intensive it is to draw a pixel and how many of those pixels you’re drawing.
The thing to realize about being Fill Rate limited, though, is that whether you’re using WebGL or some native engine, your GPU is still running things at the same speed. The web may introduce a small amount of overhead for compositing the page, but nothing about your GPU’s processing power magically gets faster when using native code. Take ShaderToy, for example: NOTHING on that site is Draw Call limited. None of the shaders wouldn’t any better if you drew the same effect using the most beautifully optimized native code in the world.
Where the web has a harder time relative to native code is when you’re Draw Call limited, and sadly it’s really easy to fall into that bucket. When you’re Draw Call limited it’s because your code can’t feed commands to the GPU fast enough, and so your GPU is just sitting around waiting for you to tell it what to draw. This can be because your code is taking too long to make the draw calls (for example: you’re waiting for physics code to finish before you start drawing), the calls you’re making are really expensive (ie: Uploading large textures or vertex buffers every frame), or because you’re making a lot of not-terribly-expensive calls that quickly add up. In my experience that last scenario is often the most likely.
Native code can be better at this part of things for a few reasons. There’s newer graphics APIs available to native code (like Metal, Vulkan, and D3D12) that can tell the GPU what to draw more efficiently. This will be mitigated quite a bit when WebGPU ships in the near-ish future. In the meantime we’ve only got WebGL to work with, which is based on the pretty old OpenGL standard and is unfortunately verbose for a lot of common operations. Using features from WebGL 2.0 when possible is the best way to close the gap until then. (Libraries like Babylon.js will do this for you automatically.) Native code also has less overhead than JavaScript, so every function call in JavaScript tends to cost a little bit more, and native code tends to have better ways to parallelize work.
Even so, it’s easy to become Draw Call limited in native code as well, and the biggest difference is that the popular engines like Unity and Unreal have more robust tools to help you fix it. There’s no magic bullets to be had here, though, and most of the best performing native apps need to go through the same types of asset optimization that will benefit your web app.
So let’s take a look at what we can do to make things better for our little island scene.
A quick note about the “problems” we’ll be addressing
Before we go any further, I want to point out that I’m going to spend a lot of time talking about various “problems” and “fixes” for 3D meshes, and that might make it sound like the artist for any particular mesh was being sloppy or incompetent. Nothing could be further from the truth!
There tends to be a natural tension between what’s good for the creating and editing 3D models and what’s good for realtime rendering. As you’ll see below a lot of the “optimizations” we’re going to apply would make an artists life much, much harder if they used them as part of their standard process. You can hardly blame someone for prioritizing their own workflow.
Additionally, in some cases, the optimizations we apply will depend on the needs of your specific app, which the artist obviously didn’t know if you’re using random online assets. Unless you’re lucky enough to have dedicated artists on your team that know what your applications exact needs, you’ll just need to get used to putting some work into tailoring other people’s work to your needs.
Finding the bottlenecks
As with anything in development, we shouldn’t dive into optimizing anything until we’ve been able to measure the problem, so let’s do some profiling! With any mobile device that uses a Chromium-based browser (that includes Oculus Go and Oculus Quest), you can pull up dev tools for pages running on your device from Chrome on your PC. Just plug your device in with a USB cable, make sure Development Mode is enabled (device specific but easily searchable), and navigate to about:inspect with Chrome on your PC. (I can’t give you a direct link because Chrome requires you to enter it manually.) From there you should be able to see your mobile device listed as well as every tab open on the device. (You may need to accept a prompt to allow USB debugging on the device after ou open the page.) For me it looks like this:
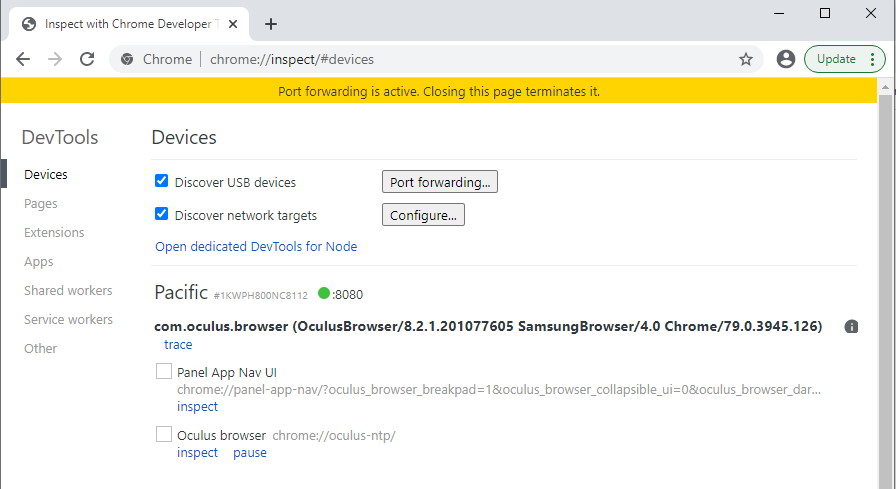
“Pacific” is the internal name for the Oculus Go, so that’s the headset I’m trying to debug.
If you click on the inspect link for the tab you want to debug, you should see a (hopefully) familiar window, with all the dev tools you know and love now pointed at the tab on your mobile device.
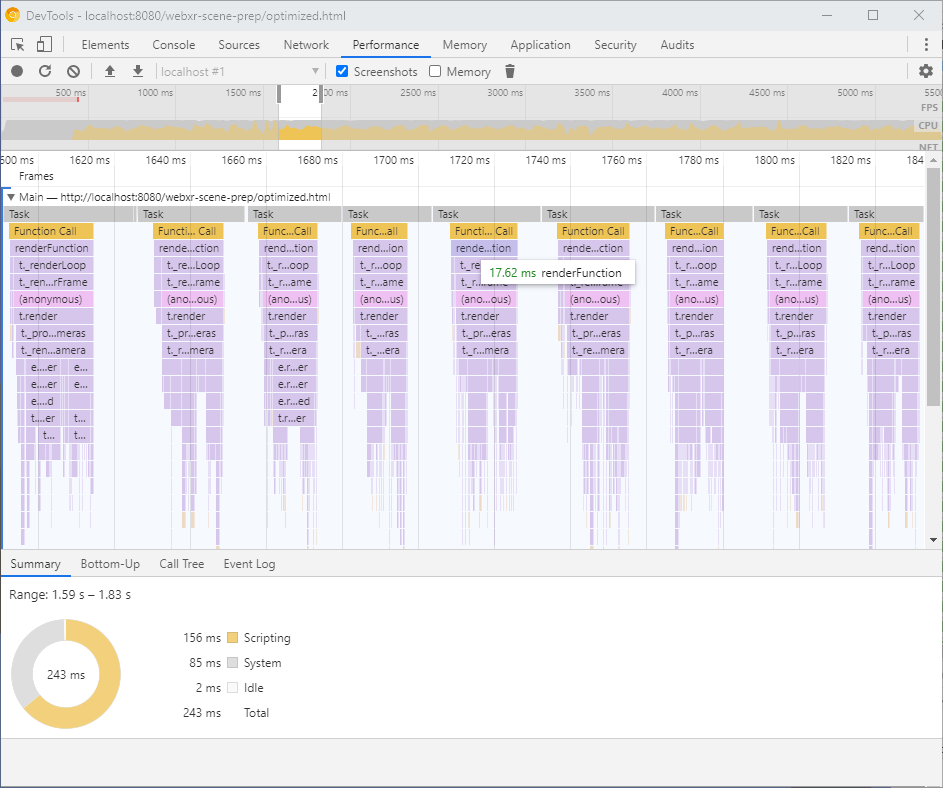
From here, we’ll want to jump to the Performance tab and record a few seconds of profiling data to help give us an idea of where our frame time in being spent.

Make sure your page is already in VR or AR, then click the Record button and let it record a few seconds of data, ideally while wiggling your device around a bit so the data is slightly more “real world”. When you stop it, you’ll see a screen like this:
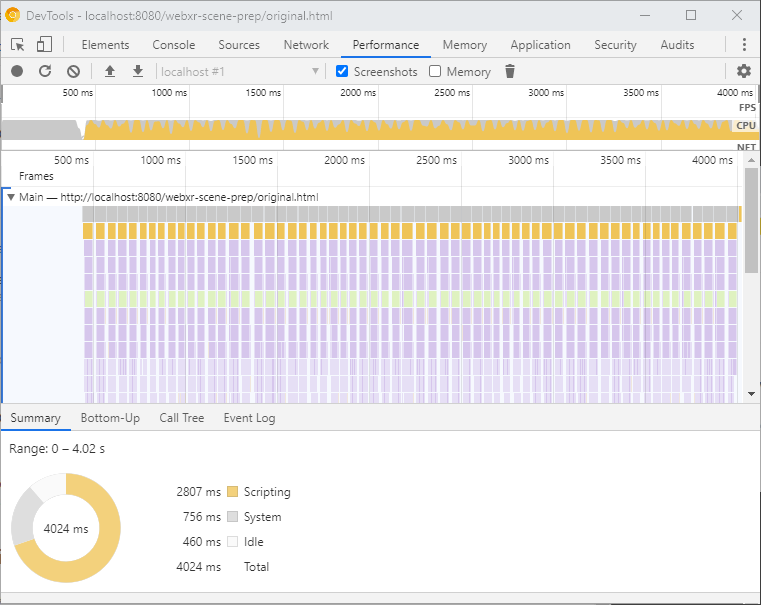
Use your mouse wheel to zoom in on the Frames graph in the middle till you can clearly make out the individual columns of function calls, like so:
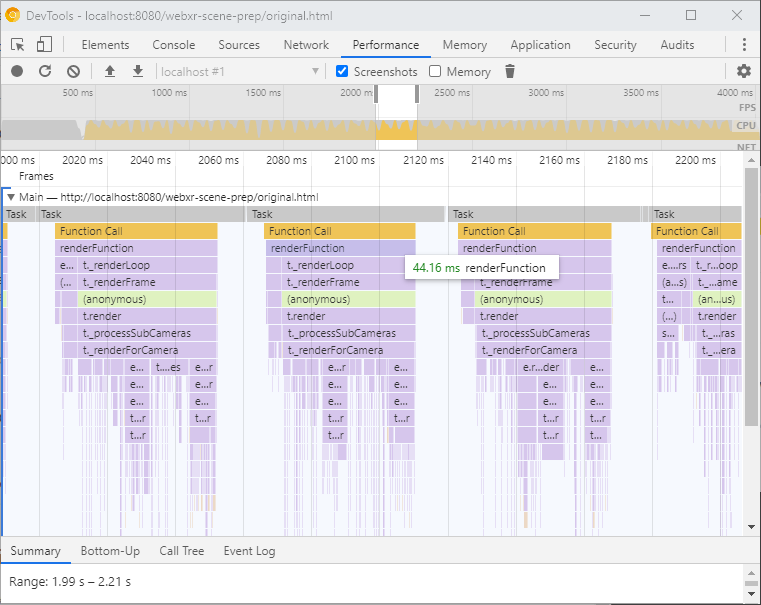
Each of those separate columns of calls (with the Task bar at the top) represents a single frame, and all the bars underneath it represent the call stack of functions made in that frame and how long each of them took respectively. At the top, just under the orange Function Call we can see a renderFunction bar. This, in my case, is the main call that Babylon.js is using to handle all the frame logic and thus represents how much time my page is spending running Javascript code each frame. If we mouse over it, we can see it’s about 44ms per frame.
If we want to be running at the Oculus Go’s ideal framerate of 72 FPS, we need that number to be around ~13ms. So, uh…. We’re missing that. By a lot.

But! Now we know something very important: We’re definitely Draw Call limited here. We’re spending so much time in JavaScript telling the GPU what to draw that we can’t fit it all into one frame. While we may still bump into Fill Rate limits later, we know that unless we reduce the amount of work our Javascript has to do, we can never hope to meet our frame budget.
Reducing Draw Calls
One might expect that in order to reduce the amount of time we spend in JavaScript we need to optimize our code, but it’s actually our 3D assets that are causing our JavaScript to take so long. Every rendering library you’ll ever use does some variation of the following internal loop:
for (let material of scene.materials) {
  // This includes setting which shaders and textures we'll use.
  SetupMaterialValuesInWebGL();

  for (let mesh of scene.meshesThatUseMaterial(material)) {
    // This includes setting which vertex buffers will be used.
    SetMeshValuesInWebGL();

    for (let instance of scene.instancesOfMesh(mesh)) {
      // Usually just position or color
      SetInstanceValues();

      Draw();
    }
  }
}
You can generally assume that setting up the material or mesh to be used is pretty expensive, while drawing individual instances (copies) of a mesh is relatively cheap (in Javascript, not necessarily on the GPU). So logically we can assume that if we reduce the number of materials or meshes we’re using we can reduce the overall time spent in this loop.
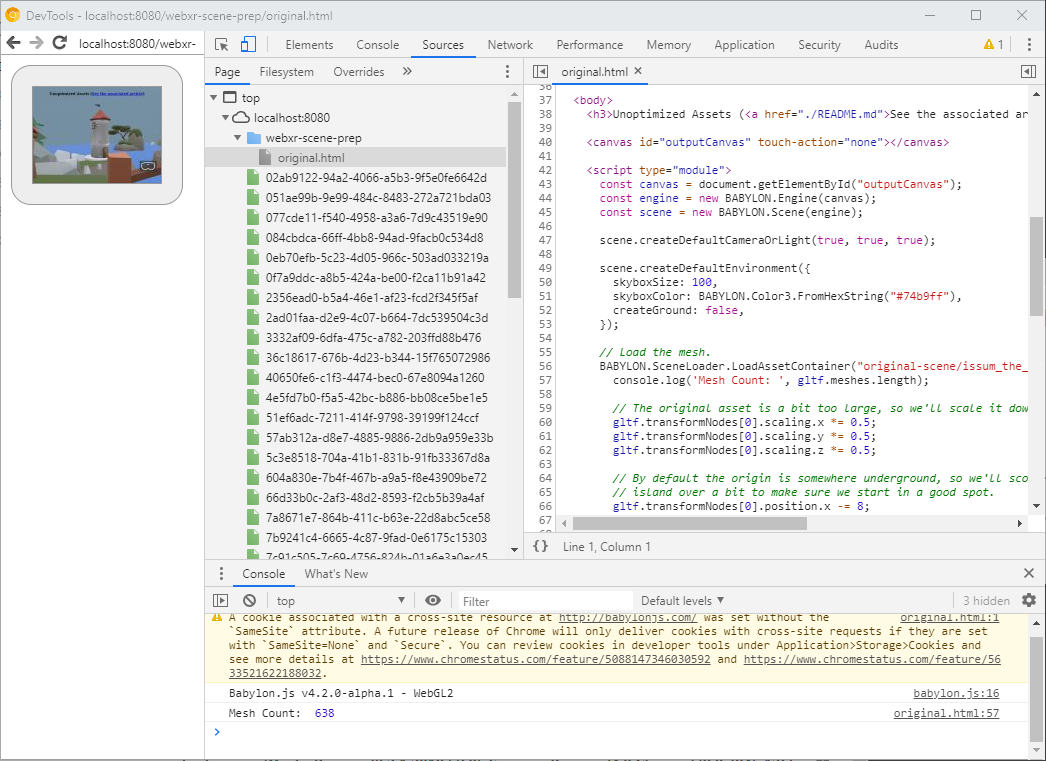
So how many materials/meshes do we have now? Fortunately Babylon.js makes the list of meshes and materials easily accessible, so I can print their length to the console to find out:
BABYLON.SceneLoader.LoadAssetContainer(contentPath, "scene.gltf", scene, function (gltf) {
  console.log('Material Count: ', gltf.materials.length);
  console.log('Mesh Count: ', gltf.meshes.length);
});
Which gives me:
Material Count:  49
Mesh Count:  638
If I go look at some of the performance recommendations for my target device (detailed here) the rough estimate is that I should only be submitting 50-100 draw calls per frame, and that’s in a native environment. If we assume that each mesh is equal to at least one draw call, two if we’re doing stereo rendering for VR, uh…. We’re over that. By a lot.
(See: “This is Fine” dog above. Maybe picture even more fire.)
Incidentally, those same guidelines also say we should be limiting our scene to 100k triangles, and this particular scene is roughly double that, so we’re pushing our luck on multiple fronts.
Into the Blender
So now we come to the portion of the tutorial where we break out a modeling tool. In my case I’m going to be using Blender because it’s free, pretty powerful, and reasonably easy to use. It also has very nice glTF import/export support! If you have a different tool you’re comfortable with of course feel free to use it. If you’re not familiar with any 3D modeling tools then give Blender a try, but at least take a moment to learn how to navigate the viewport first before reading further.
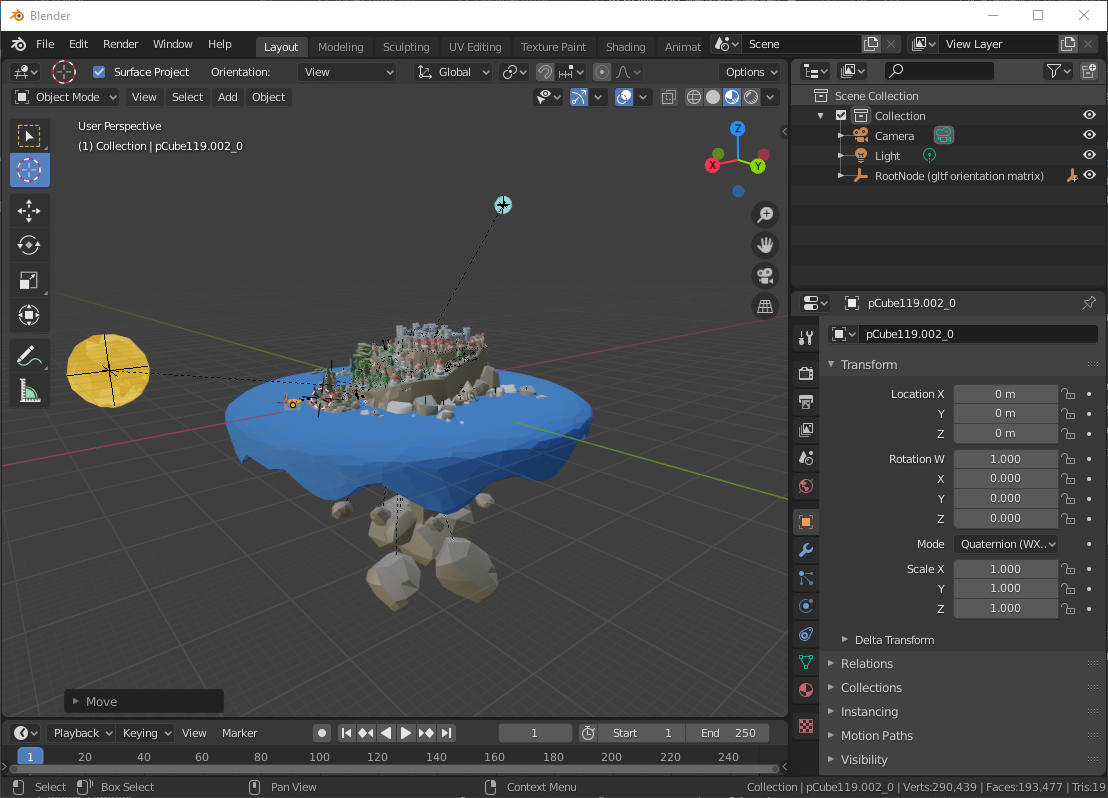
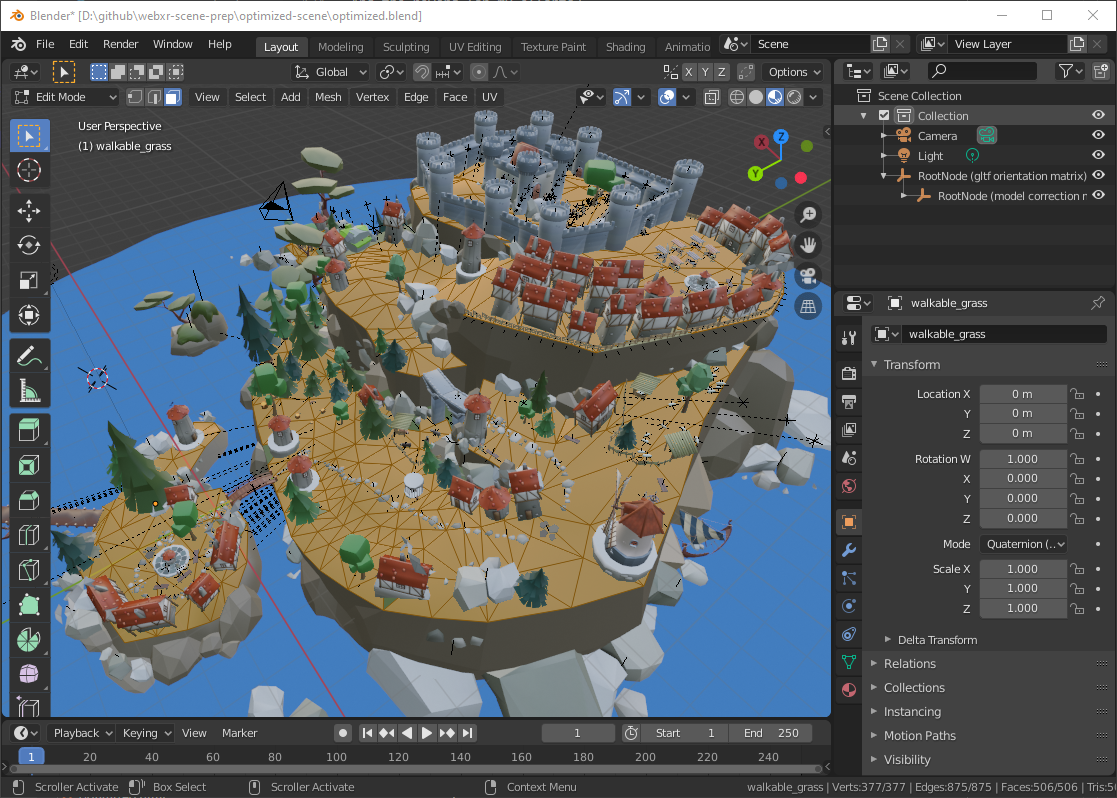
The first thing we want to do is try and find any meshes that the user won’t be able to see and get rid of them. No sense in spending time rendering that’s never shown, right? You need to take into account where you expect the user to be able to move, which in my case is all over the top of the island. However just by looking at the zoomed out view here I can see that there’s a bunch of rock formations under the island that look cool if you’re viewing the island as a table-like diorama, but won’t do anything for my experience where the user stays on the island itself. So the very first thing I’m going to do is get rid of those.
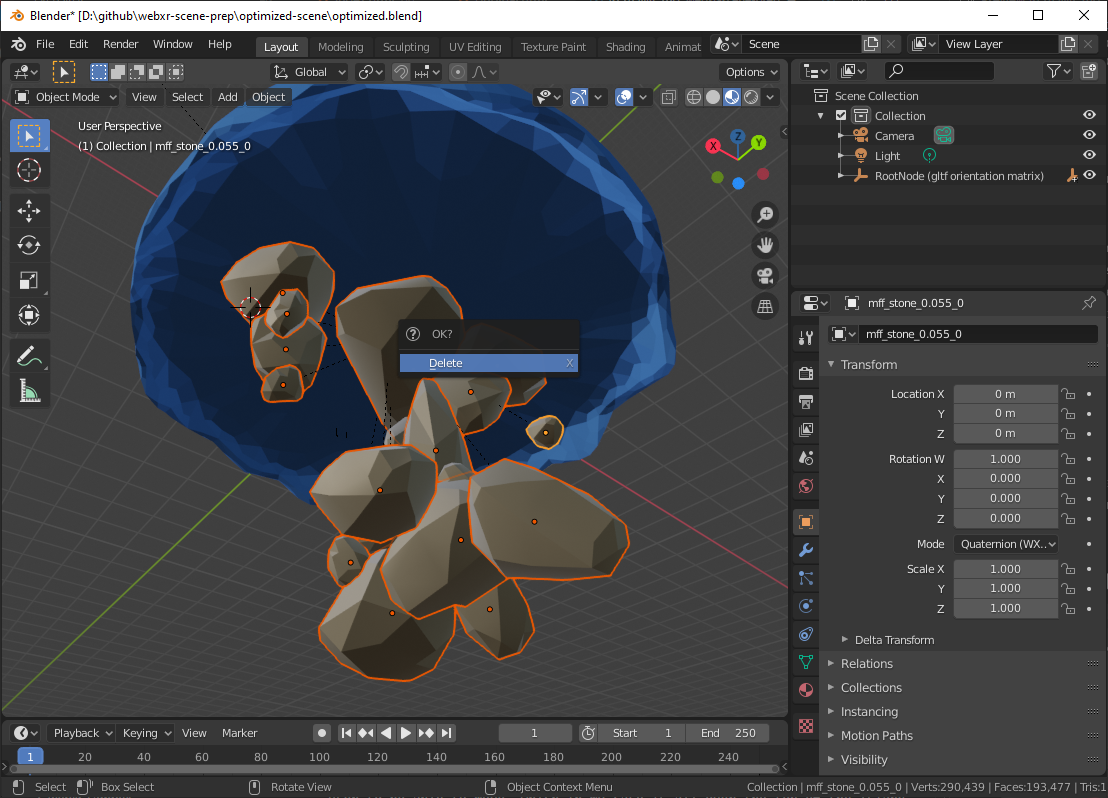
I can do this in Blender’s Object Mode by selecting all the rocks (Shift+Click to add to your selection) and then hit the Delete or X key.
I also deleted a few other items as well as I spin around the island, mostly very small meshes in out of the way places where I don’t thing the player will ever notice even if they technically can see it. So that takes care of the obvious meshes I can get rid of without hurting the aesthetic. Let’s see how we did!
Mesh Count: 638 -> 614
Hrm… not a terribly impressive reduction. But fear not! We have a much more powerful trick up our sleeve.
Merging by Material
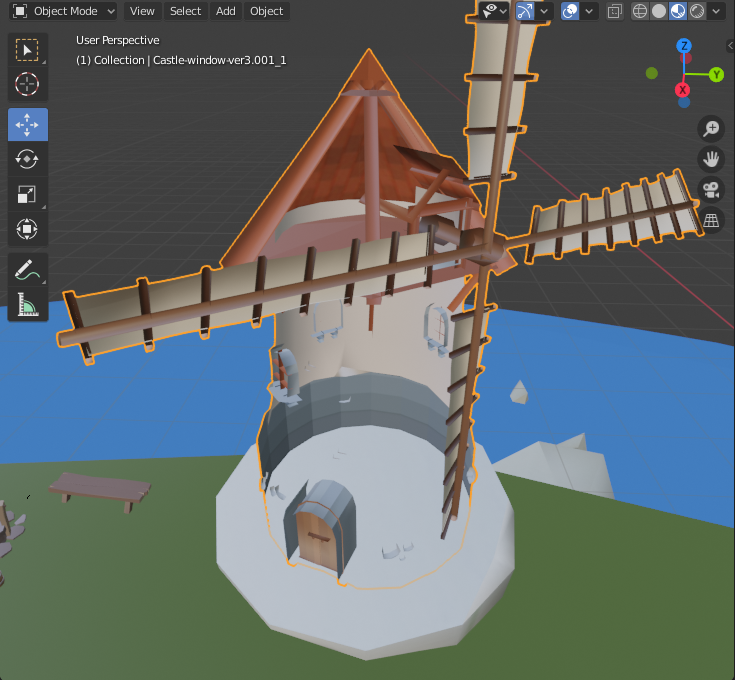
If you look around the island, you’ll see that there’s a LOT of objects that share the same material (texture/color/shininess/etc.) Let’s look at the towers of the castle for example.
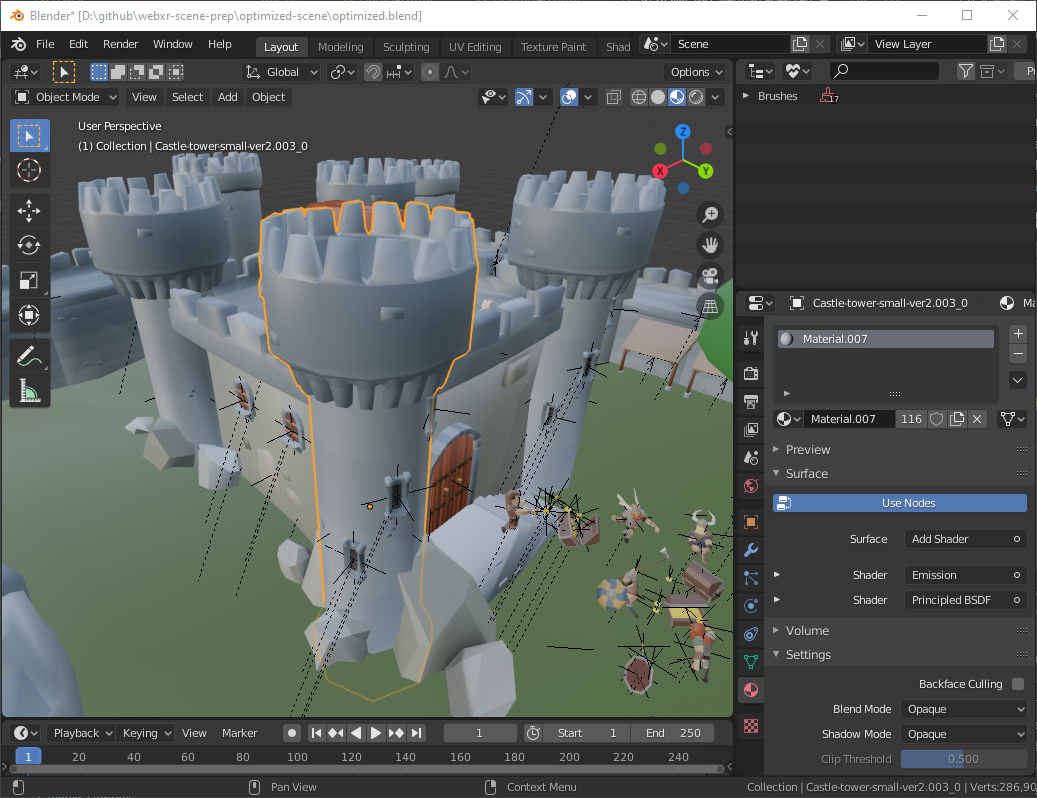
You’ll notice in the right hand pane I’ve got the materials tab open and it shows that this tower is using the descriptively names “Material.007”. Furthermore, next to it is a number that shows how many other meshes in the scene are using the same material. 116! If we click around the scene to see other objects with the same material we’ll find it’s used on the castle walls, bridges, houses, even the sheep! It’s pretty common for artists to reuse their materials multiple times throughout a scene simply because it’s often easier on them to do it that way.
When materials do get reused across multiple meshes, we can apply a really easy trick: Merging most/all of the meshes using a that material into one big mesh!
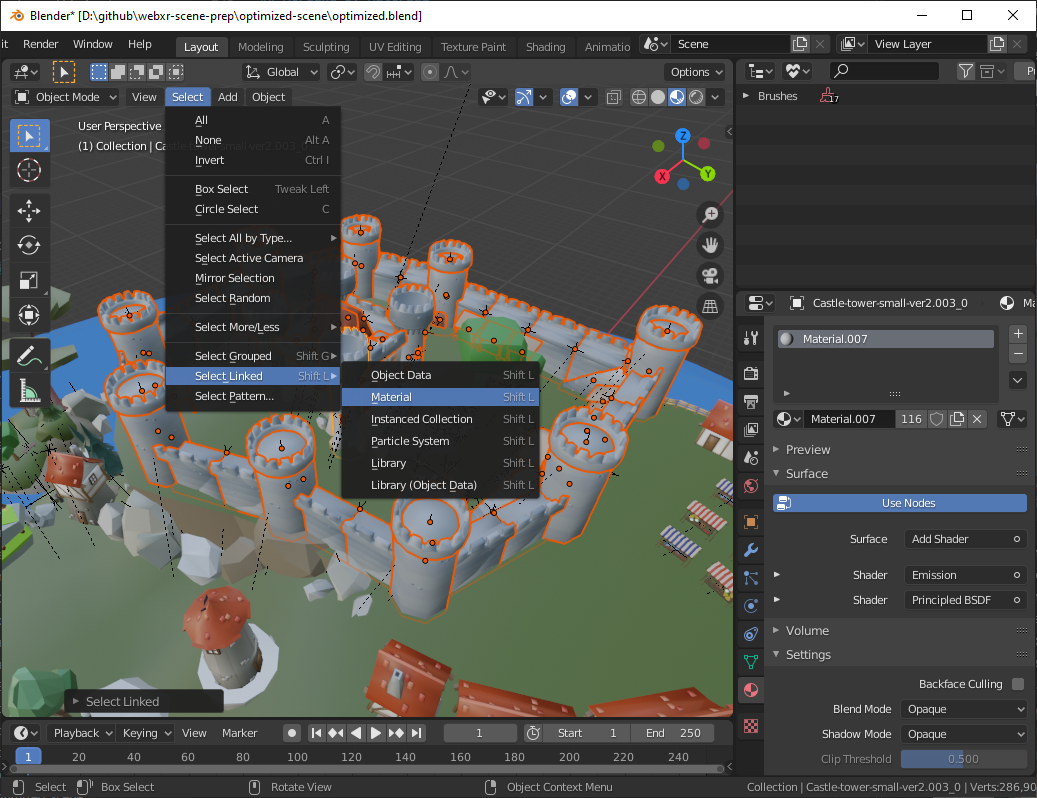
Blender makes this particularly easy on us: In Object Mode select any mesh using the shared material, then click the Select menu -> Select Linked -> Material, and now every mesh in the scene that uses the same material will be selected!
Then we can join them together into one big mesh by clicking the Object menu -> Join.
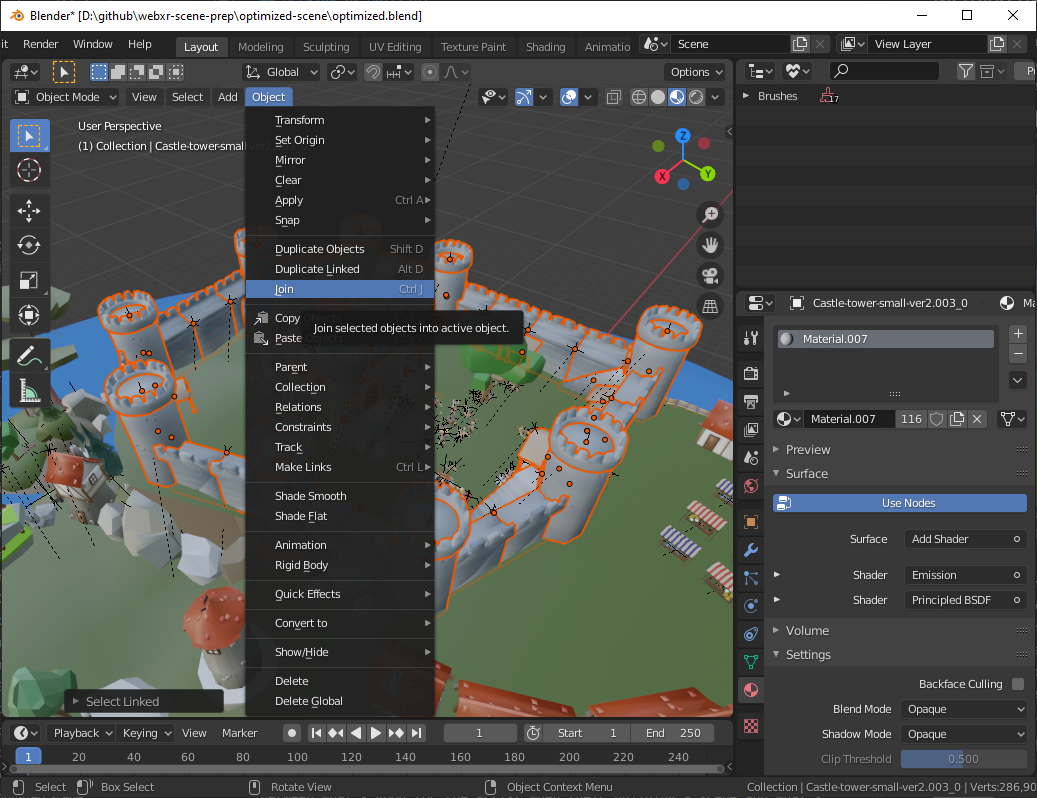
And presto! We’ve now removed 115 mesh switches from our rendering loop!
There’s a lot of other opportunities for the same thing in this scene. Houses, fences, people, stones, etc. all were re-used by the artist all over the island, so I’ve gone through and merged them all. The Outliner view in the upper right corner is really helpful for this. Any triangle icon you see is a mesh, so you can just spin through the list and find any meshes with shared materials.
And the reward for my efforts?
Mesh Count: 614 -> 53
Now THAT’S a big improvement! Let’s see how it performs in the headset.
Woo! SO much better! We still get some black borders if we’re whipping our head around fast, but more typical movements look just fine and even the quick movements don’t look bad when you’re actually in the headset. Happily our profiling tools show the same level of improvement.
We’re still not down to the ideal ~13ms frame time, but this is immensely better and actually feels pretty decent thanks to the hardware’s reprojection capabilities.
When not to Merge
That was such a huge boost in the performance of our scene, you may wonder why you’d ever NOT want to merge meshes. But, as it turns out, there’s a bunch of good reasons why you may want to leave your meshes separated, even when they share the same material.
First and foremost is if you’re still editing the scene. Merged meshes are great for rendering but a major pain for mesh placement. For example, if, after merging, we try to move just one of the rocks on the island we’ll find that almost every other rock on the island now wants to move at the same time. We can still move single features if we’re willing to go into Edit Mode and select all the faces individually (a time consuming task), but it’s much easier to change the layout when everything is still separate. As such the mesh merging should usually be done as a last step, and it’s a good idea to keep an un-merged copy of the asset around in case you need to edit it later.
For mostly the same reasons, if you have individual meshes that you want to move around at runtime, you should leave them separate as well. For instance: There’s various birds around the island, and if I wanted to have them fly around on some preset path it’s easiest to leave them separate so I can either keyframe the animation in Blender or do it programmatically in my page script.
I also found that in the process of doing the merge I accidentally stomped on the meshes that I was using in the unoptimized version for teleportation. (The floorMeshes that you pass to Babylon’s createDefaultXRExperience method.) This turned out to be a happy accident, though, as it forced me to pick out only the individual triangles I wanted to be able to “walk” on in the mesh (done in Edit Mode) and split them out into a separate mesh (Mesh menu -> Separate -> Selection).
Finally, depending on your scene and rendering library, it can be useful to limit the mesh merging to more closely grouped objects to aid frustum culling and/or occlusion culling. Frustum culling is when the rendering library is able to easily determine that a given mesh won’t be visible because it’s outside the field of view of the camera, and as such doesn’t need to be submitted for rendering at all. The problem is that if, for example, every house on the island is part of the same mesh some portion of that merged mesh is pretty much always visible and thus the entire merged mesh is always drawn.
The GPU does a lot of internal tricks to figure out which triangles aren’t visible very early on and discard them, so this isn’t the end of the world, and unless you’re seeing that your page is Fill Rate limited it may not be worth it to introduce more potential draw calls for the purposes of allowing better culling. This is a case-by-case thing, and you should pay attention to your own page’s performance characteristics to determine how to proceed.
Reducing the number of materials
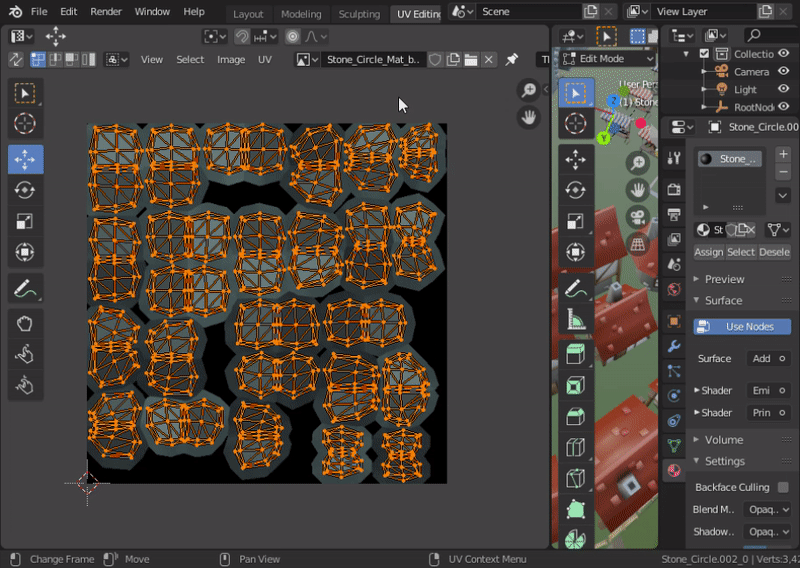
A common way of reducing the number of materials used is to use Texture Atlases, though it’s a method that takes a bit more manual work than the merging we did above. A texture atlas is simply combining several textures into one larger one. Depending on the scene and how aggressively you’re optimizing it you can either batch a few textures from similar objects into one or entire scene’s worth of textures into one big atlas. For this scene I opted for just atlasing a few textures for similar objects. For example, I noticed that there were some stone circles that were always paired with bases that used a stone wall texture, so I combined those two textures into one in an image editor:
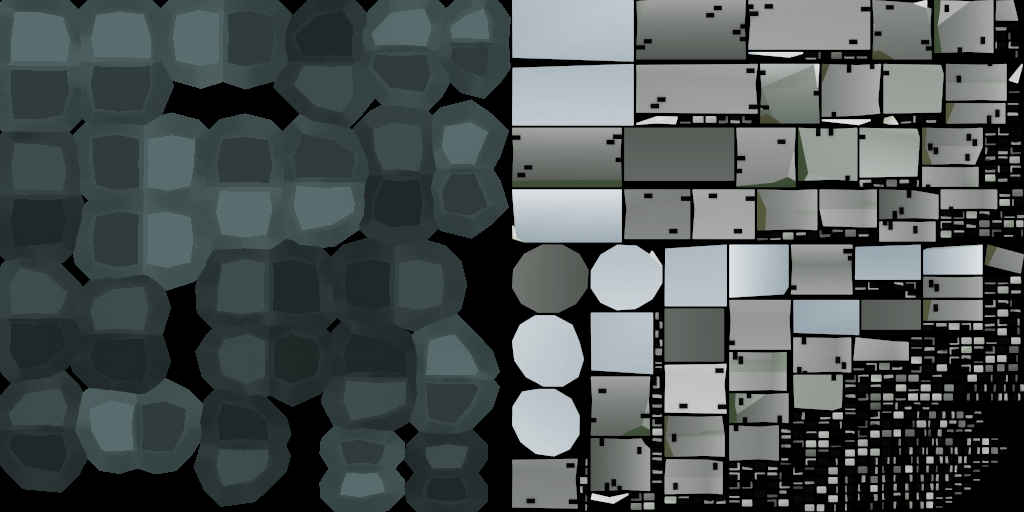
Then, in Blender, I changed the material for one of the meshes to use the atlas texture, and assigned that material to the other mesh as well. Then the final step is to adjust the texture coordinates for each set of meshes to cover only their portion of the atlas. This is done in the UV Editor view with the model faces you want to edit selected in Edit Mode. You can see me adjusting the coordinates here:
And of course, once the meshes are sharing a material they’re good candidates for merging!
Also, while on my merge-a-palooza I also noticed that there were a couple of textures that shipped with the model that happened to be identical. Browsing through the materials in Blender, I found that they were being used in effectively identical materials applied to different meshes. For example: The little Golem on one end of the island shared an identical material with some tree stumps, but both materials were using a different copy of the same texture. Because of this I was able to set both sets of meshes to use a single material, which then let me merge them as well.
In the end I got a modest reduction of the number of meshes using these techniques, and every bit helps when you’re talking about mobile hardware.
Mesh Count: 53 -> 34
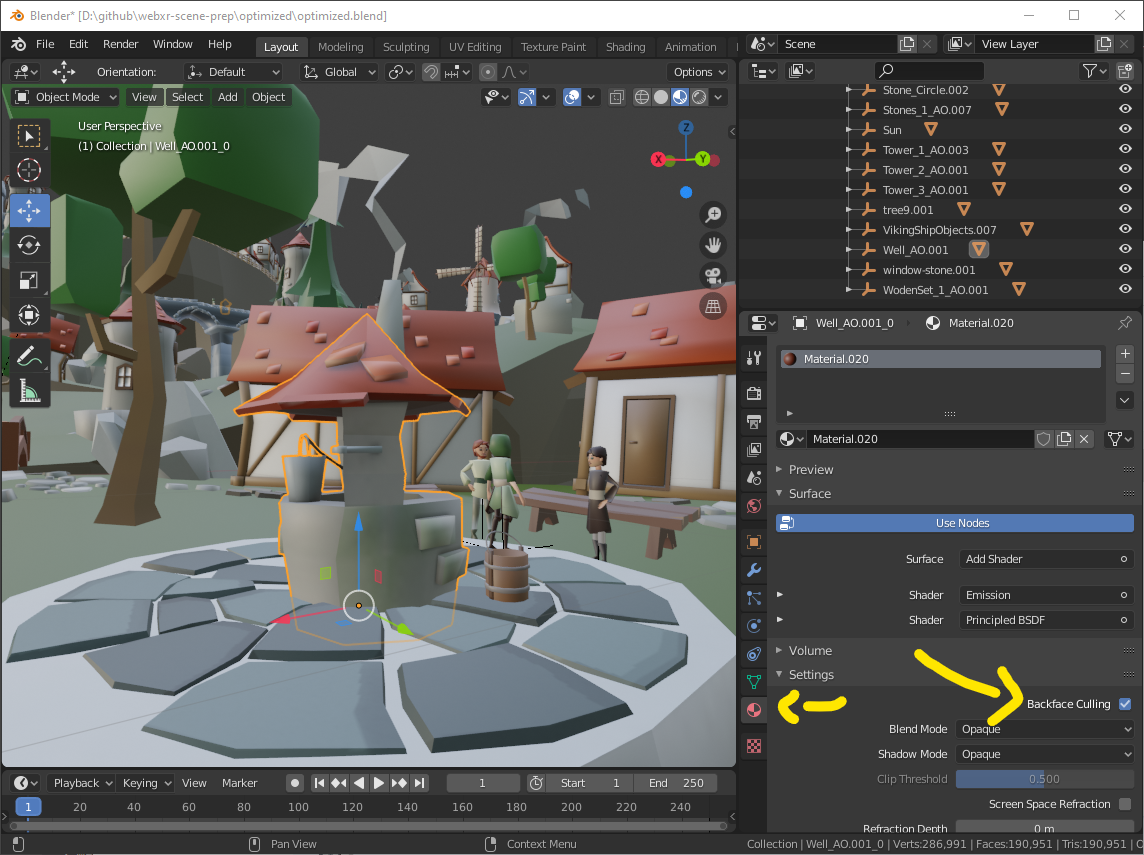
Backface culling
Something that won’t help with reducing the number of draw calls but CAN speed up your rendering (especially if you are Fill Rate limited) is making sure that you turn on the Backface Culling option for as many materials as you can. This checkbox can be found in the Materials Properties tab, and it tells the renderer to not draw any triangles that are facing “away” from you. Applied consistently this can allow your GPU to stop working early on many of the triangles in your field of view.
There’s a few situations where it shouldn’t apply, though, and some cases where you may have to fix something before it can be used. In every case you should visually inspect objects as you turn backface culling on to make sure you’re getting the desired effect. Ideally as you toggle the checkbox off and on you shouldn’t see your mesh change, and if it does you’ll either need to fix the mesh or leave backface culling off.
To start, you rarely want to use backface culling when your object has any transparency but it also depends on the effect you want. Also, if you have any geometry that consists of just a single “sheet” of polygons turning on backface culling will make them disappear when viewed from one side. This is an issue, for example, on the little smoke wisps that are coming out of some of the chimneys on the island.
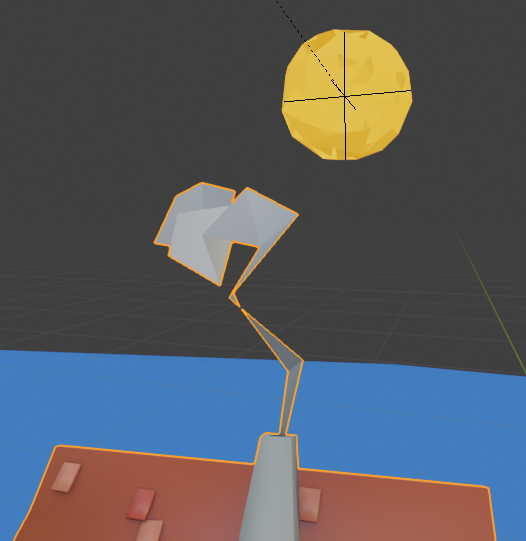
If we turn on backface culling they look like this:
So here the proper thing to do is to leave backface culling off, but I have a small problem because they’re part of the house meshes (they share the same material) which I DO want to apply backface culling to. Depending on your circumstances you could either split these meshes apart from the parts you do want to apply backface culling to or leave them merged and don’t backface cull any of it. Which route you go largely depends on if your scene is Draw Call or Fill Rate limited.
Finally, you might turn on backface culling and see that your mesh appears to turn inside out, like this:
(This actually wasn’t a problem for this scene, I forced the error so I could show what it looked like.)
If you see something like that it means you have “flipped normals”, which basically means that the surfaces of polygons that make up your object are “pointing” at the inside of your object rather than the outside like we want them to. The way we fix this is by selecting the object, entering Edit mode, making sure we’re in Face Select mode, and selecting all the faces that are flipped like this. (If it’s the entire mesh, like you see above, just click the Select menu -> All) Once the faces are selected click the Mesh menu -> Normals -> Flip and you should see your object starts looking correct again.
Improving load times
At this point I think I’m going to stop optimizing for rendering, because we’re doing OK on that front. The Oculus Go I’ve been testing with primarily is still a bit jumpy depending on the angle you look at the island from, but it’s a tolerable experience now, as opposed to being completely unusable when we started. And when you bump up to more powerful hardware like the Oculus Quest it feels pretty good!
However, we’re still dealing with long load times for the page, which is mostly due to our fairly large (for the web) assets. If we’re exporting to a separate .gltf/bin/textures we can see the breakdown looks something like this:
.gltf:    133KB
.bin:     10.6MB
textures: 6.63MB
----------------
Total:    17.3MB
Let’s see what we can do about that so that our users can start seeing our content faster!
Mesh size optimization
The .bin file contains all of our mesh data, so things like vertex positions and triangle layouts. This may seem difficult to reduce the size of without removing details from our scene, but fortunately we have some excellent tools to help us out!
Follow the instructions on that page to learn how to install and use it, but I’ll cover the highlights here:
First off, while it doesn’t directly affect the total file size, it’s helpful to package our separate .gltf/bin/texture files up into a single binary glTF file (.glb). This helps streamline the download a bit by getting rid of some HTTP overhead for each file. Blender will export to a .glb directly (it’s the default setting), but in some cases it can be good to be able to inspect what Blender’s outputting more directly, so the exporting as separate files can be nice during development.
Next we can pull out the big guns: Draco Compression. This compression library takes our vertex data and crunches it down losslessly to a fraction of it’s original size, and it’s as easy as checking a checkbox on the export dialog.
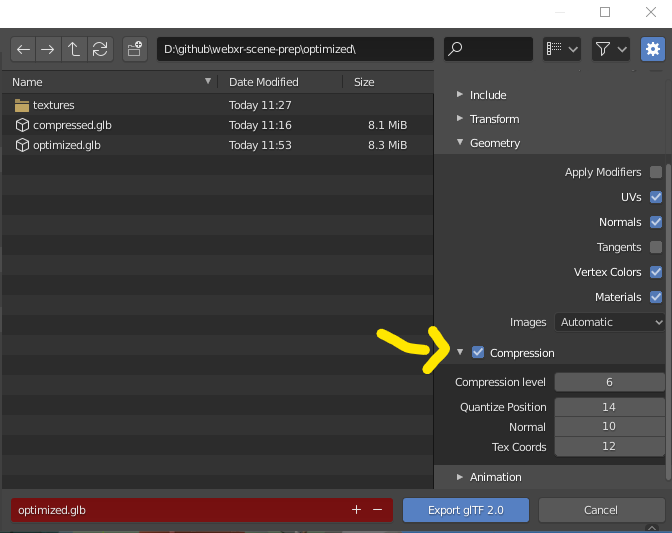
Support for decoding Draco compressed files is also built in to frameworks like Babylon.js and Three.js, so loading them is painless.
So how much does Draco reduce our file size? Just ticking that checkbox gives us a file that’s 9.2MB smaller, which means we’ve reduced the mesh data to 13% of it’s original size! There is some decompression overhead introduced when loading the mesh, and the page will need to load the decompression library as well, so the full story of how much load time this actually saves the user isn’t as straightforward as we’d like, but in most cases, especially for large meshes, it’s an easy win.
For workflows not using Blender, I cannot recommend glTF-Pipeline highly enough. It’s an easy-to-use command line tool that will handle packing, unpacking, and compressing your glTF files quite nicely.
Image optimization
If you’ve been doing much work on the web in the past you may be familiar with some of the tricks of the trade when it comes to image size reduction, and most of them apply here.
The easiest thing to look for are any images that seem too big for their intended purpose. For example, there’s a lot of textures in this scene that are just blotches of solid color, like this:
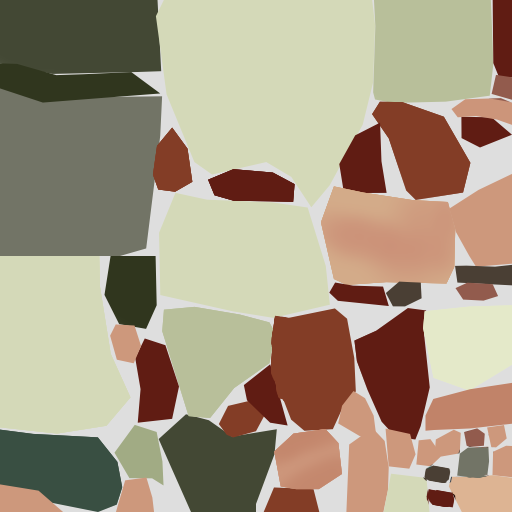
That image is 512x512 px, and it just really doesn’t need to be. We can easily scale it down to a quarter that size (256x256) and not lose anything important.
It’s also worth checking to see if saving any particular image as a JPEG vs. PNG yields better file sizes. PNGs can be smaller for large areas of flat colors (like above), while JPEGs tend to be smaller (but lossy) for more detailed images. Of course if you need transparency then you should always keep the image as a PNG.
(TODO: Need a section about making use of BASIS compressed images here.)
End Results
And that wraps up this walkthrough! Let’s take a look at the numbers at the end of the day:
Materials: 49 -> 34
Meshes: 638 -> 38
Number of Files: 51 -> 1
File Size: 21.7MB -> 8.2MB
Frame JS time: ~44ms -> ~13ms (Oculus Go)
               ~34ms -> ~7ms  (Oculus Quest)
Not bad! Not bad at all!
You can see the live version of the optimized page here and compare to the unoptimized version we linked at the beginning of this guide to see exactly how much of a difference we’ve made.
Thanks for reading, and good luck with your own projects!
–Brandon